Color palette extraction with K-means clustering | Machine Learning from Scratch (Part IV)
— Machine Learning, Statistics, Clustering — 4 min read
Share
TL;DR Build K-Means clustering model using Python from Scratch. Use your model to find dominant colors from UI mobile design screenshots.
Choosing a color palette for your next big mobile app (re)design can be a daunting task, especially when you don’t know what the heck you’re doing. How can you make it easier (asking for a friend)?
One approach is to head over to a place where the PROs share their work. Pages like Dribbble, uplabs and Behance have the goods.
After finding mockups you like, you might want to extract colors from them and use those. This might require opening specialized software, manually picking color with some tool(s) and other over-the-counter hacks. Let’s use Machine Learning to make your life easier.
Complete source code notebook on Google Colaboratory
Unsupervised Learning
Up until now we only looked at models that require training data in the form of features and labels. In other words, for each example, we need to have the correct answer, too.
Usually, such training data is hard to obtain and requires many hours of manual work done by humans (yes, we’re already serving “The Terminators). Can we skip all that?
Yes, at least for some problems we can use example data without knowing the correct answer for it. One such problem is clustering.
What is clustering?
Given some vector of data points X, clustering methods allow you to put each point in a group. In other words, you can categorize a set of entities, based on their properties, automatically.
Yes, that is very useful in practice. Usually, you run the algorithm on a bunch of data points and specify how much groups you want. For example, your inbox contains two main groups of e-mail: spam and not-spam (were you waiting for something else?). You can let the clustering algorithm create two groups from your emails and use your beautiful brain to classify which is which.
More applications of clustering algorithms:
- Customer segmentation - find groups of users that spend/behave the same way
- Fraudulent transactions - find bank transactions that belong to different clusters and identify them as fraudulent
- Document analysis - group similar documents
The Data
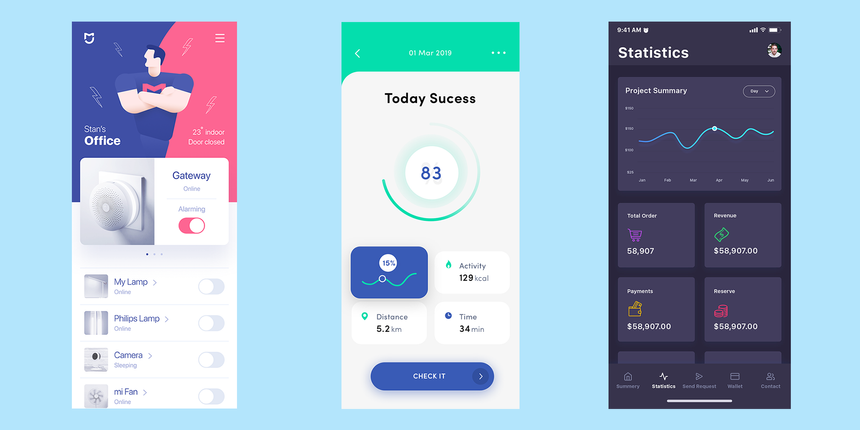
 source: various authors on https://www.uplabs.com/
This time, our data doesn’t come from some predefined or well-known dataset. Since Unsupervised learning does not require labeled data, the Internet can be your oyster.
Here, we’ll use 3 mobile UI designs from various authors. Our model will run on each shot and try to extract the color palette for each.
What is K-Means Clustering?
K-Means Clustering is defined by Wikipedia as:
k-means clustering is a method of vector quantization, originally from signal processing, that is popular for cluster analysis in data mining. k-means clustering aims to partition n observations into k clusters in which each observation belongs to the cluster with the nearest mean, serving as a prototype of the cluster. This results in a partitioning of the data space into Voronoi cells.
Wikipedia also tells us that solving K-Means clustering is difficult (in fact, NP-hard) but we can find local optimum solutions using some heuristics.
But how do K-Means Clustering works?
Let’s say you have some vector X that contains n data points. Running our algorithm consists of the following steps:
- Take random k points (called centroids) from X
- Assign every point to the closest centroid. The newly formed bunch of points is called cluster.
- For each cluster, find new centroid by calculating a new center from the points
- Repeat steps 2-3 until centroids stop changing
Let’s see how can we use it to extract color palettes from mobile UI screenshots.
Data Preprocessing
Given our data is stored in raw pixels (called images), we need a way to convert it to points that our clustering algorithm can use.
Let’s first define two classes that represent a point and cluster:
1class Point:23 def __init__(self, coordinates):4 self.coordinates = coordinatesOur Point is just a holder to the coordinates for each dimension in our space.
1class Cluster:23 def __init__(self, center, points):4 self.center = center5 self.points = pointsThe Cluster is defined by its center and all other points it contains.
Given a path to image file we can create the points as follows:
1def get_points(image_path):2 img = Image.open(image_path)3 img.thumbnail((200, 400))4 img = img.convert("RGB")5 w, h = img.size67 points = []8 for count, color in img.getcolors(w * h):9 for _ in range(count):10 points.append(Point(color))1112 return pointsA couple of things are happening here:
- load the image into memory
- resize it to smaller image (mobile UX requires big elements on the screen, so we aren’t losing much color information)
- drop the alpha (transparency) information
Note that we’re creating a Point for each pixel in our image.
Alright! You can now extract points from an image. But how can we calculate the distance between points in our clusters?
Distance function
Similar to the cost function in our supervised algorithm examples, we need a function that tells us how well we’re doing. The objective of our algorithm is to minimize the distance between the points in each centroid.
One of the simplest distance functions we can use is the Euclidean distance, defined by:
d(p,q)=i=1∑n(qi−pi)2where p and q are two points from our space.
Note that while Euclidean distance is simple to implement it might not be the best way to calculate the color difference.
Here is the Python implementation:
1def euclidean(p, q):2 n_dim = len(p.coordinates)3 return sqrt(sum([4 (p.coordinates[i] - q.coordinates[i]) ** 2 for i in range(n_dim)5 ]))Implementing K-Means clustering
Now that you have all pieces of the puzzle you can implement the K-Means clustering algorithm. Let’s start with the method that finds the center for a set of points:
1def calculate_center(self, points):2 n_dim = len(points[0].coordinates)3 vals = [0.0 for i in range(n_dim)]4 for p in points:5 for i in range(n_dim):6 vals[i] += p.coordinates[i]7 coords = [(v / len(points)) for v in vals]8 return Point(coords)To find the center of a set of points, we add the values for each dimension and divide by the number of points.
Now for finding the actual clusters:
1def assign_points(self, clusters, points):2 plists = [[] for i in range(self.n_clusters)]34 for p in points:5 smallest_distance = float('inf')67 for i in range(self.n_clusters):8 distance = euclidean(p, clusters[i].center)9 if distance < smallest_distance:10 smallest_distance = distance11 idx = i1213 plists[idx].append(p)1415 return plists1617def fit(self, points):18 clusters = [Cluster(center=p, points=[p]) for p in random.sample(points, self.n_clusters)]1920 while True:2122 plists = self.assign_points(clusters, points)2324 diff = 02526 for i in range(self.n_clusters):27 if not plists[i]:28 continue29 old = clusters[i]30 center = self.calculate_center(plists[i])31 new = Cluster(center, plists[i])32 clusters[i] = new33 diff = max(diff, euclidean(old.center, new.center))3435 if diff < self.min_diff:36 break3738 return clustersThe implementation follows the description of the algorithm given above. Note that we exit the training loop when the color difference is lower than the one set by us.
Evaluation
Now that you have an implementation of K-Means clustering you can use it on the UI screenshots. We need a little more glue code to make it easier to extract color palettes:
1def rgb_to_hex(rgb):2 return '#%s' % ''.join(('%02x' % p for p in rgb))34def get_colors(filename, n_colors=3):5 points = get_points(filename)6 clusters = KMeans(n_clusters=n_colors).fit(points)7 clusters.sort(key=lambda c: len(c.points), reverse = True)8 rgbs = [map(int, c.center.coordinates) for c in clusters]9 return list(map(rgb_to_hex, rgbs))The get_colors function takes a path to an image file and the number of colors you want to extract from the image. We sort the clusters obtained from our algorithm based on the points in each (in descending order). Finally, we convert the RGB colors to hexadecimal values.
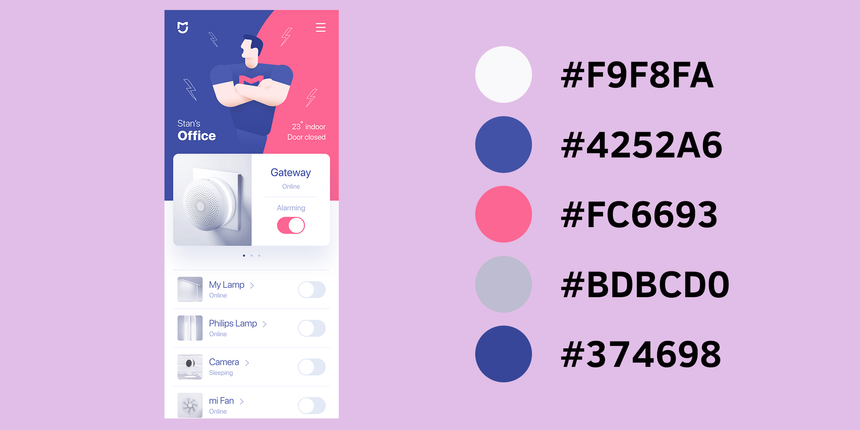
Let’s extract the palette for the first UI screenshot from our data:
1colors = get_colors('ui1.png', n_colors=5)2", ".join(colors)and here are the hexadecimal color values:
1#f9f8fa, #4252a6, #fc6693, #bdbcd0, #374698And for a visual representation of our results:

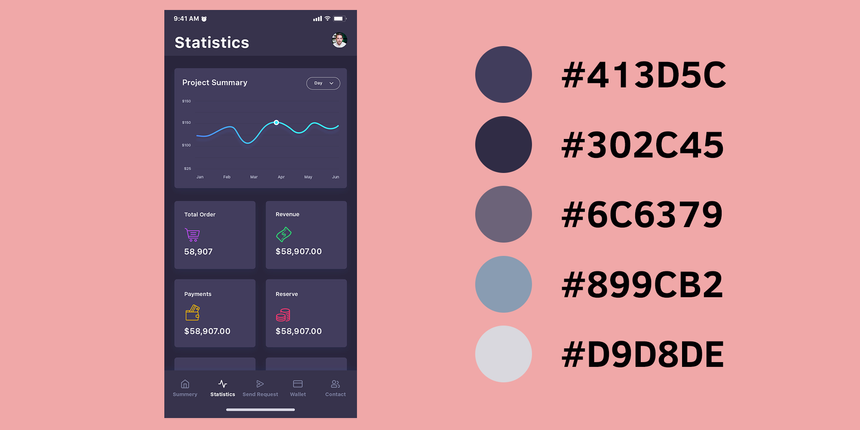
Running the clustering on the next two images, we obtain the following:

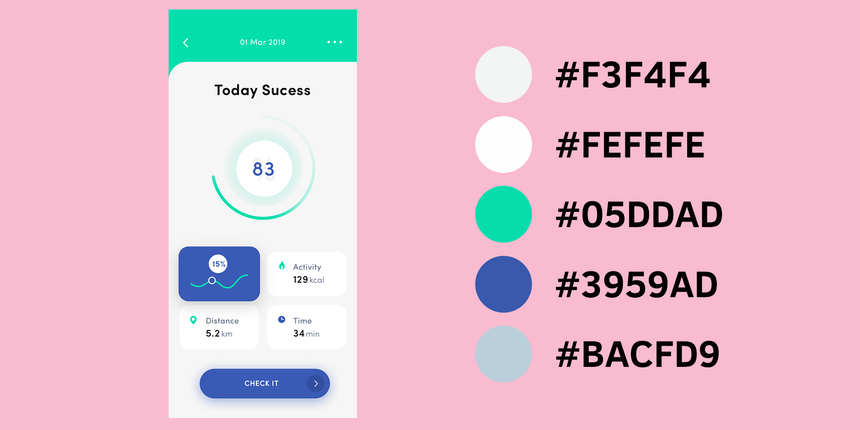
The last screenshot:

Well, that looks cool, right? Go on try it on your own images!
Complete source code notebook on Google Colaboratory
Conclusion
Congratulations, you just implemented your first unsupervised algorithm from scratch! It also appears that it obtains good results when trying to extract a color palette from images.
Next up, we’re going to do sentiment analysis on short phrases and learn a bit more how we can handle text data.
Share
Want to be a Machine Learning expert?
You'll never get spam from me