Time Series Classification for Human Activity Recognition with LSTMs in Keras
— Deep Learning, Keras, TensorFlow, Time Series, Python — 3 min read
Share
TL;DR Learn how to classify Time Series data from accelerometer sensors using LSTMs in Keras
Can you use Time Series data to recognize user activity from accelerometer data? Your phone/wristband/watch is already doing it. How well can you do it?
We’ll use accelerometer data, collected from multiple users, to build a Bidirectional LSTM model and try to classify the user activity. You can deploy/reuse the trained model on any device that has an accelerometer (which is pretty much every smart device).
This is the plan:
Run the complete notebook in your browser
The complete project on GitHub
Human Activity Data
Our data is collected through controlled laboratory conditions. It is provided by the WISDM: WIreless Sensor Data Mining lab.
The data is used in the paper: Activity Recognition using Cell Phone Accelerometers. Take a look at the paper to get a feel of how well some baseline models are performing.
Loading the Data
Let’s download the data:
1!gdown --id 152sWECukjvLerrVG2NUO8gtMFg83RKCF --output WISDM_ar_latest.tar.gz2!tar -xvf WISDM_ar_latest.tar.gzThe raw file is missing column names. Also, one of the columns is having an extra ”;” after each value. Let’s fix that:
1column_names = [2 'user_id',3 'activity',4 'timestamp',5 'x_axis',6 'y_axis',7 'z_axis'8]910df = pd.read_csv(11 'WISDM_ar_v1.1/WISDM_ar_v1.1_raw.txt',12 header=None,13 names=column_names14)1516df.z_axis.replace(regex=True, inplace=True, to_replace=r';', value=r'')17df['z_axis'] = df.z_axis.astype(np.float64)18df.dropna(axis=0, how='any', inplace=True)19df.shape1(1098203, 6)The data has the following features:
user_id- unique identifier of the user doing the activityactivity- the category of the current activitytimestampx_axis,y_axis,z_axis- accelerometer data for each axis
What can we learn from the data?
Exploration
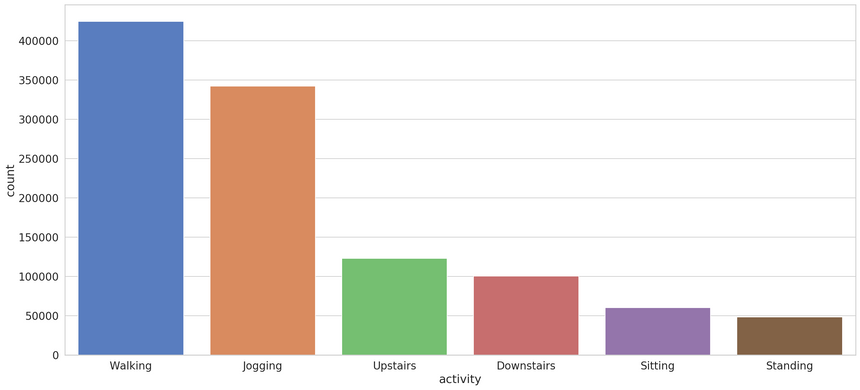
We have six different categories. Let’s look at their distribution:

Walking and jogging are severely overrepresented. You might apply some techniques to balance the dataset.
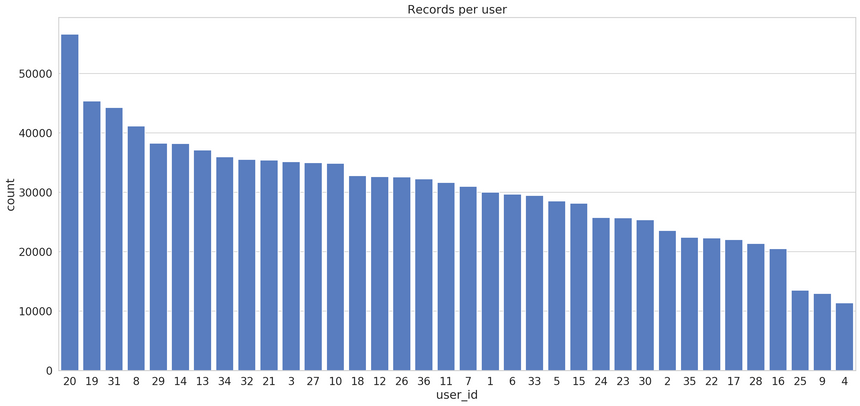
We have multiple users. How much data do we have per user?

Most users (except the last 3) have a decent amount of records.
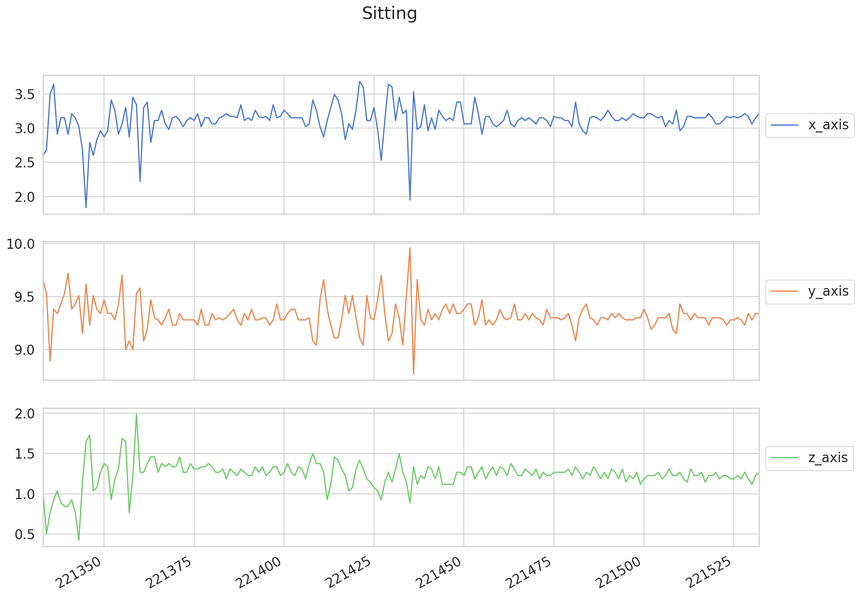
How do different types of activities look like? Let’s take the first 200 records and have a look:

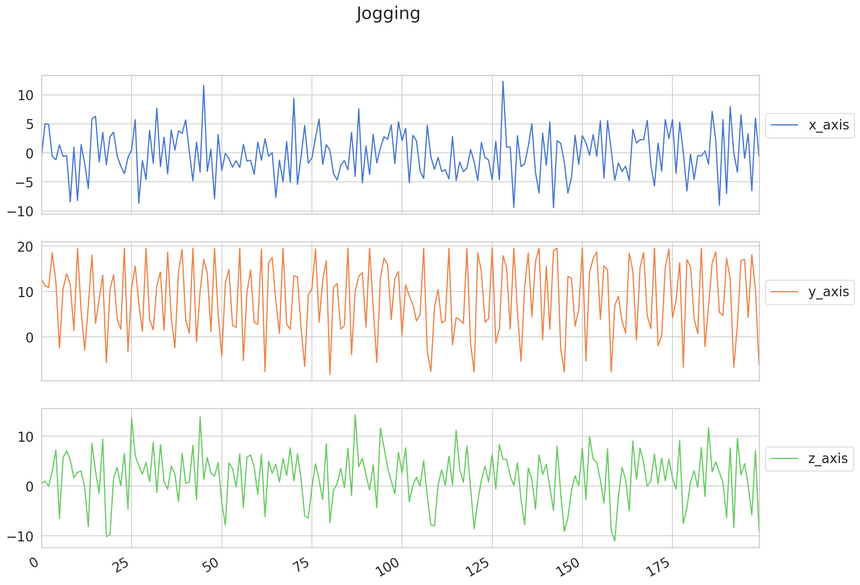
Sitting is well, pretty relaxed. How about jogging?

This looks much bouncier. Good, the type of activities can be separated/classified by observing the data (at least for that sample of those 2 activities).
We need to figure out a way to turn the data into sequences along with the category for each one.
Preprocessing
The first thing we need to do is to split the data into training and test datasets. We’ll use the data from users with id below or equal to 30. The rest will be for training:
1df_train = df[df['user_id'] <= 30]2df_test = df[df['user_id'] > 30]Next, we’ll scale the accelerometer data values:
1scale_columns = ['x_axis', 'y_axis', 'z_axis']23scaler = RobustScaler()45scaler = scaler.fit(df_train[scale_columns])67df_train.loc[:, scale_columns] = scaler.transform(8 df_train[scale_columns].to_numpy()9)1011df_test.loc[:, scale_columns] = scaler.transform(12 df_test[scale_columns].to_numpy()13)Note that we fit the scaler only on the training data. How can we create the sequences? We’ll just modify the create_dataset function a bit:
1def create_dataset(X, y, time_steps=1, step=1):2 Xs, ys = [], []3 for i in range(0, len(X) - time_steps, step):4 v = X.iloc[i:(i + time_steps)].values5 labels = y.iloc[i: i + time_steps]6 Xs.append(v)7 ys.append(stats.mode(labels)[0][0])8 return np.array(Xs), np.array(ys).reshape(-1, 1)We choose the label (category) by using the mode of all categories in the sequence. That is, given a sequence of length time_steps, we’re are classifying it as the category that occurs most often.
Here’s how to create the sequences:
1TIME_STEPS = 2002STEP = 4034X_train, y_train = create_dataset(5 df_train[['x_axis', 'y_axis', 'z_axis']],6 df_train.activity,7 TIME_STEPS,8 STEP9)1011X_test, y_test = create_dataset(12 df_test[['x_axis', 'y_axis', 'z_axis']],13 df_test.activity,14 TIME_STEPS,15 STEP16)Let’s have a look at the shape of the new sequences:
1print(X_train.shape, y_train.shape)1(22454, 200, 3) (22454, 1)We have significantly reduced the amount of training and test data. Let’s hope that our model will still learn something useful.
The last preprocessing step is the encoding of the categories:
1enc = OneHotEncoder(handle_unknown='ignore', sparse=False)23enc = enc.fit(y_train)45y_train = enc.transform(y_train)6y_test = enc.transform(y_test)Done with the preprocessing! How good our model is going to be at recognizing user activities?
Classifying Human Activity
We’ll start with a simple Bidirectional LSTM model. You can try and increase the complexity. Note that the model is relatively slow to train:
1model = keras.Sequential()2model.add(3 keras.layers.Bidirectional(4 keras.layers.LSTM(5 units=128,6 input_shape=[X_train.shape[1], X_train.shape[2]]7 )8 )9)10model.add(keras.layers.Dropout(rate=0.5))11model.add(keras.layers.Dense(units=128, activation='relu'))12model.add(keras.layers.Dense(y_train.shape[1], activation='softmax'))1314model.compile(15 loss='categorical_crossentropy',16 optimizer='adam',17 metrics=['acc']18)The actual training progress is straightforward (remember to not shuffle):
1history = model.fit(2 X_train, y_train,3 epochs=20,4 batch_size=32,5 validation_split=0.1,6 shuffle=False7)How good is our model?
Evaluation
Here’s how the training process went:

You can surely come up with a better model/hyperparameters and improve it. How well can it predict the test data?
1model.evaluate(X_test, y_test)1[0.3619675412960649, 0.8790064]~88% accuracy. Not bad for a quick and dirty model. Let’s have a look at the confusion matrix:
1y_pred = model.predict(X_test)

Our model is confusing the Upstairs and Downstairs activities. That’s somewhat expected. Additionally, when developing a real-world application, you might merge those two and consider them a single class/category. Recall that there is a significant imbalance in our dataset, too.
Conclusion
You did it! You’ve build a model that recognizes activity from 200 records of accelerometer data. Your model achieves ~88% accuracy on the test data. Here are the steps you took:
You learned how to build a Bidirectional LSTM model and classify Time Series data. There is even more fun with LSTMs and Time Series coming next :)
Run the complete notebook in your browser
The complete project on GitHub
References
Share
Want to be a Machine Learning expert?
You'll never get spam from me